Data Visualization
What Is Data Visualization and Why It Matters
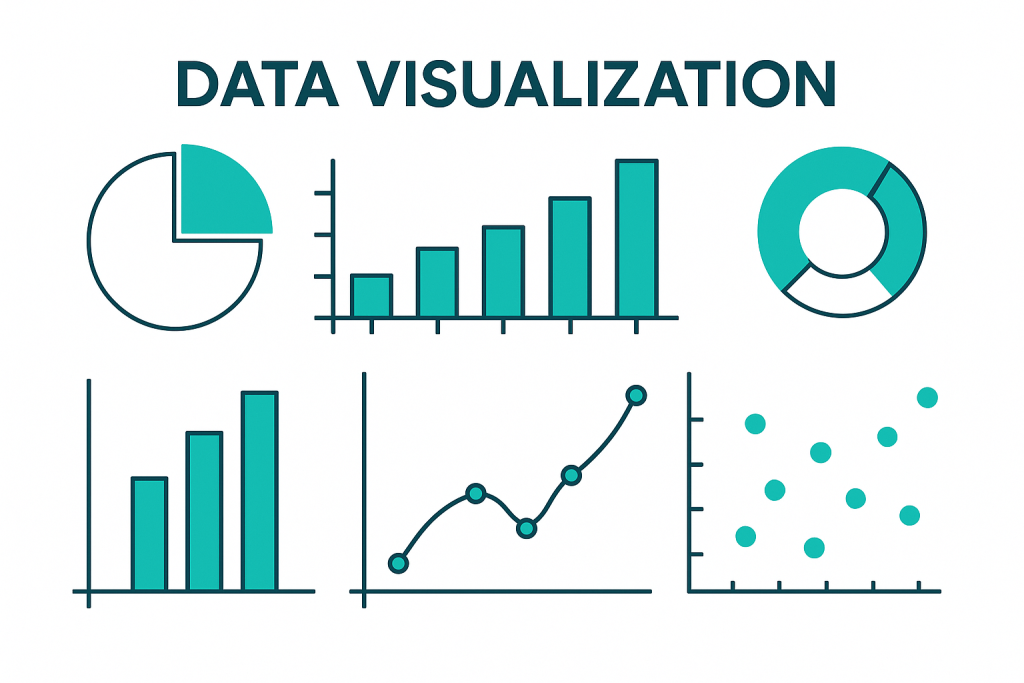
Data visualization is the art of presenting data through visuals like charts, graphs, maps, and infographics. It helps simplify complex information, making it easier to spot patterns, trends, and outliers that may be hidden in spreadsheets or raw reports. At Technokeens IT Solutions Pvt. Ltd., we believe that clear visuals lead to clearer decisions. From business leaders and analysts to marketers and product teams, everyone benefits from data that is easy to interpret, quick to digest, and actionable turning numbers into knowledge and insights into strategy.
Overview
What We Offer: Full-Scale Data Visualization Services
At Technokeens, we go beyond basic charts. We provide comprehensive data visualization consulting that covers:
- Custom Dashboard Design: Tailored, role-based dashboards that give each stakeholder the insights they need.
- Real-Time Data Integration: Connecting live data sources for up-to-date visualization.
- Interactive Visual Reports: Let your users explore data through filters, toggles, and dynamic charts.
- Mobile-Friendly Visualizations: Optimized for all screen sizes for decision-making on the go.
- UI UX-driven Solutions: Interfaces designed for clarity, speed, and ease-of-use.
As a data visualization specialist, we bring both analytical depth and design finesse to every project.
Our Expertise
The Key Role of UI UX Design
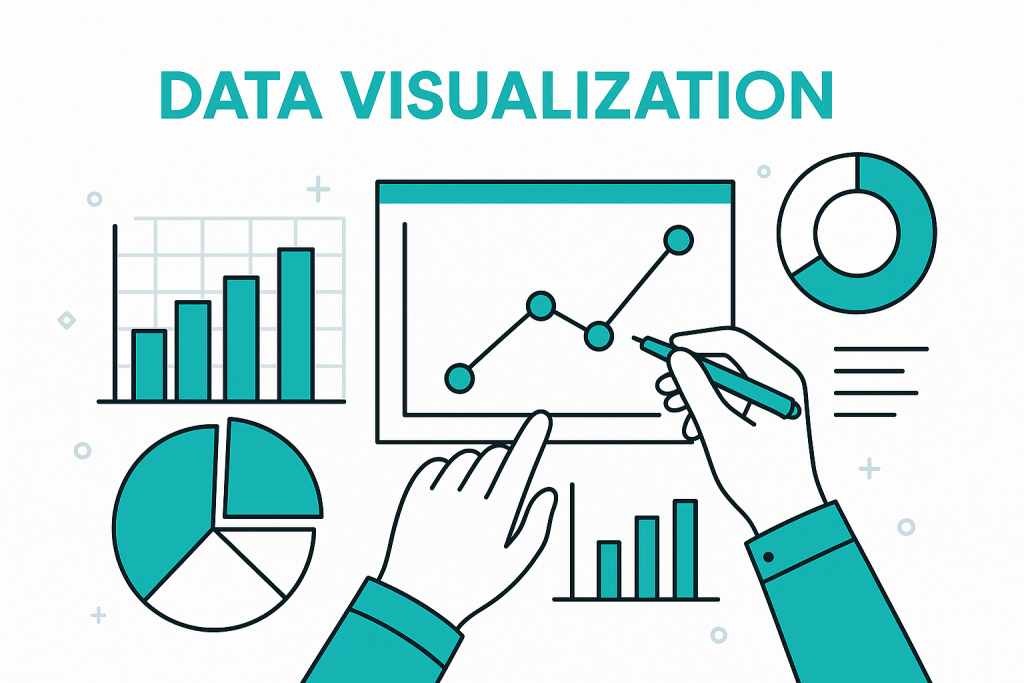
What makes data visualization truly effective isn’t just how it looks it’s how it feels and functions in the hands of a real user. That’s where UI UX design becomes indispensable. At Technokeens, we believe that good data design goes beyond visuals; it’s about creating intuitive, meaningful, and seamless interactions with data.
Our UI UX experts collaborate closely with analysts and stakeholders to build dashboards and reports that are not only visually compelling but also easy to navigate, interpret, and act upon even for non-technical users. We pay attention to everything from layout hierarchy and color usage to filter behavior and responsiveness, ensuring clarity and usability at every level.
Benefits
Benefits of Working with a Data Visualization Specialist
Partnering with a data visualization consulting company like Technokeens offers significant advantages:
- Improved data comprehension and faster decisions
- Enhanced storytelling and presentations for stakeholders
- Reduced cognitive load and reporting time
- Greater transparency and data literacy across teams
- Boost in operational efficiency and goal alignment
Get Your Website Audit Report Now!
Why Us
Why Choose Technokeens for Data Visualization in India
With years of experience across industries, Technokeens has earned its reputation as one of the top data visualization companies in India. Here’s what makes us different:
1. Human-Centric Approach – We focus on the end-user. Our design-led methodology ensures that visualizations don’t just look beautiful but deliver business value.
2. Strong UI UX Design Backbone – Unlike many firms, we integrate UI UX design from the start. Our designers and analysts collaborate to create seamless, intuitive interfaces that turn users into champions.
3. Technology Agnostic – Whether you prefer Power BI, Tableau, Google Data Studio, or custom-built visual layers we work with the tools that work best for your stack.
4. Domain Experience – From healthcare and finance to retail and logistics, we’ve developed dashboards and visual systems for various industries, making our solutions smarter and more adaptable.
5. Consulting + Execution – Our data visualization consulting doesn’t stop at advice. We help you implement, deploy, and scale your data strategy with reliable support and optimization.
Industries
Industries We Serve
Our team has delivered data visualization solutions for a wide variety of industries. Some of our recent work includes:
Healthcare – Patient outcomes, operational efficiency dashboards, and diagnosis tracking
Retail & E-commerce – Customer behavior analytics, sales dashboards, and inventory heatmaps
Finance – Fraud detection visuals, portfolio risk dashboards, and transaction analytics
Energy Audit – Energy consumption trends, compliance reporting, and real-time monitoring dashboards
Commissioning – Equipment validation reports, workflow dashboards, and performance analytics
As data visualization specialists, we tailor each solution to your business goals, industry standards, and user needs.
Process
Our Data Visualization Process
Here’s how we take your data from raw to remarkable:
Step 1: Discovery & Requirement Gathering – We start with a deep dive into your business needs, existing data structure, and end-user requirements.
Step 2: Data Audit & Strategy – Our team audits the data sources, defines KPIs, and recommends visualization strategies that align with your goals.
Step 3: Design with UI UX in Focus – We wireframe layouts, choose the right chart types, and build prototypes ensuring everything is clear, clickable, and user-friendly.
Step 4: Development & Integration – Using the latest web technologies or BI platforms, we integrate your data and build dashboards that update in real time.
Step 5: Testing & Feedback Loops – We test for performance, user experience, and clarity—refining based on your team’s feedback.
Step 6: Deployment & Support – After launch, we offer training, documentation, and ongoing support to ensure your system keeps delivering insights.
Related Case Studies
Take a look at
these related case studies

Estimate Generator And Management Portal
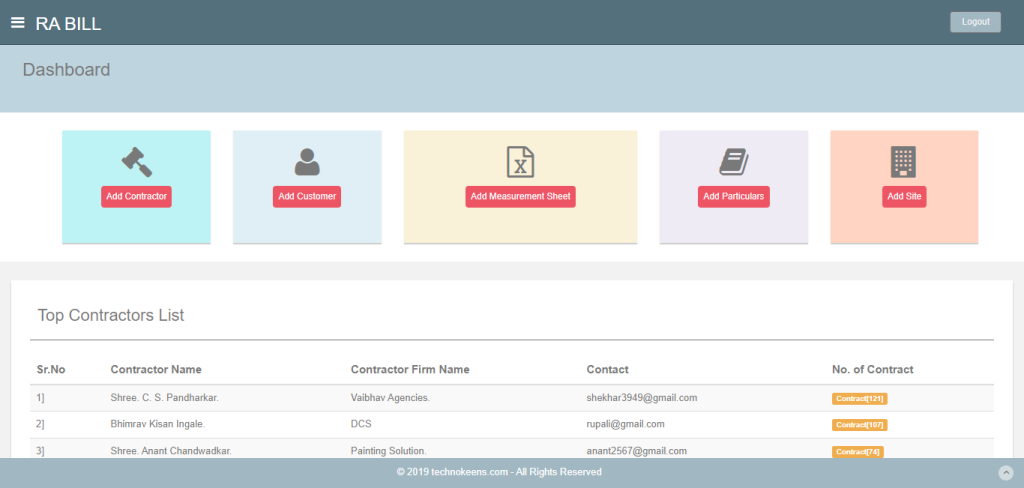
Government employees, specifically junior engineers, are responsible for creating and managing estimates in an Excel sheet. This process involves using specific formulas for calculations. However, due to the large amount of data and records, searching, deleting, and updating records is a lengthy and time-consuming task.

Student Management System

House Owner Management System

Renovation System Pro
Introducing a comprehensive project management and financial solution for the renovation industry, designed to streamline resource management, predict uncertainties with AI-driven anomaly detection, and facilitate financing through credibility analysis and fintech collaboration, complemented by a simplified and transparent bidding platform for project and property owners
E-Painter

E-Commerce Grocery Store

Taxi Booking App

Investment Advisory Service

E-Tender
